BioSocial Health J. 1(3):146-153.
doi: 10.34172/bshj.29
Original Article
Sample size calculations based on day-to-day variability of stress biomarkers in persons with dementia and their family caregivers
Azita Emami Conceptualization, Funding acquisition, Investigation, Methodology, Project administration, Resources, Supervision, Validation, Writing – review & editing, 1, 2, * 
Jeehye Jun Conceptualization, Methodology, Writing – original draft, Writing – review & editing, 3
Gabriella Engström Conceptualization, Investigation, Methodology, Project administration, Validation, Writing – review & editing, 4
Lars Berglund Formal analysis, Validation, Visualization, Writing – review & editing, 5, 6, 7
Töres Theorell Conceptualization, Methodology, Validation, Writing – original draft, Writing – review & editing, 8, 9
Author information:
1Yale School of Nursing, Yale University, PO Box 27399, West Haven, CT, 06516 USA
2Division of Occupational Therapy, Department of Neurobiology, Care Sciences, and Society, Karolinska Institutet, Fack 23 200, 141 83 Huddinge, Sweden
3Red Cross College of Nursing, Chung-Ang University, 84 Heukseok-ro, Dongjak-gu, Seoul, Republic of Korea
4Florida Atlantic University, Charles E. Schmidt College of Medicine, 777 Glades Road, Boca Raton, Florida, 33431 USA
5Department of Public Health and Caring Sciences, Geriatrics, Uppsala University, Box 564, 751 22 Uppsala, Sweden
6Epistat AB, Kungsängsvägen 27, 753 23 Uppsala, Sweden
7School of Health and Welfare, Dalarna University, Högskolegatan 2, 791 88 Falun, Sweden
8Stress Research Institute, Department of Psychology, Stockholm University, Frescativägen 8, 106 91 Stockholm, Sweden
9Division of International Public Health, Karolinska Institutet, K9 GPH Ekström, 171 77 Stockholm, Sweden
Abstract
Introduction:
Accurate estimates of intra-individual variability are necessary for proper design of clinical trials and epidemiological studies where the stress biomarkers cortisol and dehydroepiandrosterone sulfate (DHEA-S) are measured for dyads of persons with dementia (PWDs) and their family caregivers (FCGs). The aim is to determine the number of consecutive sampling days required to detect effect differences in clinical trials, and to accurately estimate regression coefficients in epidemiological studies where stress biomarkers are exposure variables in regression models with future disease as outcome.
Methods:
Clinical trial data from dyads of PWDs and their FCGs were used. Salivary cortisol and DHEA-S samples were collected five days a week, for eight consecutive weeks. From this data, we created formulas and graphical tools for the number of required sampling days needed to detect effect differences, and we calculated number of days needed for regression coefficients to be estimated with<10% bias.
Results:
A total of 5791 salivary samples from 34 dyads were used. For morning cortisol, five consecutive sampling days at baseline and an equal number of days at study termination is sufficient to detect a treatment difference>5% of baseline level with>20 dyads per group. When stress biomarkers are used in epidemiological studies at least six consecutive sampling days are required.
Conclusion:
Based on a large number of consecutive measurements of stress biomarkers we calculated the sufficient numbers of sampling days for clinical trials and for epidemiological studies to produce credible results. Our findings will aid researchers in the study design phase.
Keywords: Biomarkers, Caregivers, Clinical trial, Hydrocortisone, Dementia, Dehydroepiandrosterone sulfate, Epidemiologic studies, Sample size
Copyright and License Information
© 2024 The Author(s).
This is an open access article distributed under the terms of the Creative Commons Attribution License (
http://creativecommons.org/licenses/by/4.0/), which permits unrestricted use, distribution, and reproduction in any medium, provided the original work is properly cited.
Funding Statement
This work was supported by AMF Insurance Company in Sweden, Section of Elderly Research and the Robert G. and Jean A. Reid endowed fund from the University of Washington School of Nursing.
Introduction
Persons with dementia (PWD) and their family caregivers (FCGs) experience long-term stress that negatively affects their psychological and physical health.1 PWD demonstrate increased vulnerability and sensitivity to stress2 due to pathophysiological dysfunction (i.e., altered stress regulation) in their brain. Moreover, PWD show a tendency to misinterpret environmental stimuli as threats, indicating a lowered threshold for enduring stress.3,4
With the ongoing demographic shift toward an aging population, the number of subjects with dementia is increasing. The World Health Organization estimates that the current global total of PWD is approximately 55.2 million.5 A majority of the caregiving for PWD is provided by family or friends, who are subject to stress due to conflicting demands, unpredictable behavior of the PWD, inadequate support, lack of respite care, and lack of training on how to deal with the challenges of a PWD.
Stress is defined as a general activation reaction in response to a stimulus perceived as a challenge or threat.6 Cortisol and dehydroepiandrosterone sulfate (DHEA-S) are biomarkers that are commonly used as measures of stress. Cortisol levels start to rise from 2 AM to 4 AM, peak approximately 30 minutes after awakening, and then decline throughout the day.7 DHEA-S is simultaneously released with cortisol in response to stress and has a protective role in the stress response.8 Physiological stress in PWD and in FCGs has been assessed using tests that measure the amount of cortisol in the blood, urine, hair, or saliva.9 Salivary cortisol level has been commonly used as a stress biomarker,10 and previous research has shown that in-home saliva collection is feasible for assessing stress levels by PWD-FCG dyads.11 For studies of day-to-day variations saliva samples are preferred.
However, the variability of these stress biomarkers makes it difficult to interpret the findings in dementia and stress research for older adults because cortisol and DHEA-S levels are influenced by aging, cognitive impairment, acute stress situations and chronic stress, which may attenuate the acute reactions.9 Identification of an objective measure of stress that is sufficiently reliable, precise, and repeatable at low cost would greatly facilitate stress-related research involving PWD and/or FCGs. Reliable estimates of day-to-day variability are necessary as a basis for sample size calculation for intervention studies performed among PWD and FCGs. There is an ethical aspect to sample size calculations. Undersized studies needlessly expose possibly vulnerable patients/participants to burdens regarding interventions and collection of samples, while oversized studies unnecessarily expose some patients/participants to such burdens.
Given the cognitive decline in PWD and the beneficial effects of partnership with caregivers on health outcomes, research has increasingly focused on a dyadic approach. Unlike stress reduction interventions for either PWD or caregivers in isolation, interventions for dyads can produce an interpersonal effect (i.e., crossover effect between PWD and their caregivers) as well as an intrapersonal effect (i.e., within individuals).12
In recent decades, extensive studies of stress interventions have been conducted with PWD and/or their caregivers, including psychosocial and psychoeducational interventions, multicomponent interventions, and use of support groups.13 Several epidemiological studies have investigated relations between stress biomarkers and common diseases. Morning cortisol has been shown to be related to the development of dementia.14 However, intervention studies using physiological stress biomarkers for PWD-FCG dyads are in their early stages. For example, a randomized trial of a companion robot for PWD-FCG dyads to test the effects of intervention used hair cortisol levels as a measure of stress response.15
There are many interventions that could be tested for stress reduction in patients with dementia and caregivers. Music listening may decrease physiological arousal and emotional responses, but whether it results in a reduction in physiological stress among PWD and/or FCGs has rarely been tested using an objective marker of stress. In this study music listening was used as an example of a potential stress reducing intervention, but the research question could be applied to any such intervention. As with other interventions, according to a systematic review of stress biomarkers used in assessing music interventions, many studies testing such interventions are hampered by small sample sizes.16 One of the goals of psychosocial interventions is to improve human interaction. Effective dyadic intervention to reduce stress may result in amplified differences in cortisol and DHEA-S variability patterns due to a restored capacity to regulate stress hormones.17 We need to develop our knowledge regarding how biomarkers of stress can be used in the care of demented persons and how they react in their caregivers. Such objective measures supplement other assessments of stress and may be valuable for judgements regarding choice of interventions and routines.
In general, random intra-individual variability in predictor variables in regression models introduces bias (regression dilution) into estimated associations.18 The intraclass correlation coefficient (ICC) provides an estimate in linear regression models and an approximate estimate in logistic and Cox regression models of the relative regression dilution bias for models with a single predictor.19 To reduce this bias in the design stage of a study, knowledge of the size of random variability is necessary.
To facilitate the design of future studies for PWD-FCG dyads, we sought to determine how many consecutive sampling days were required to establish salivary cortisol and DHEA-S differences between intervention and control groups for a given number of dyads in a study design. In addition, we wanted to provide evidence-based recommendations on how many consecutive sampling days are needed to dampen intra-individual variability to reduce bias in estimated associations when salivary cortisol and DHEA-S are utilized as exposure variables in risk factor models with future disease as outcome.
Methods
Sample and setting
This study involved secondary analysis of the data collected during a two-group, non-randomized open trial examining the effects of music listening on physiological markers of stress among PWD and their FCGs.11 The data utilized in this study were collected in participants’ homes in Sweden from November 2018 to March 2020. The parent study received approval from the Karolinska Institutet Institutional Review Board, Stockholm, Sweden (Dnr: 2018/1596-31/2).
A total of 34 PWD-FCG dyads were included in the study, adhering to specific inclusion and exclusion criteria. Eligible PWDs met the following criteria: (1) were 65 years of age or older, (2) had received a diagnosis of dementia from a physician, (3) had moderate to very severe cognitive decline as defined by a Global Deterioration Scale (GDS) score of 4 to 7,20 (4) had a Brief Agitation Rating Scale (BARS) score greater than 15,21 (5) were living at home with an FCG, and (6) agreed to participate in the study (or a proxy agreed to their participation). Eligible FCGs were required to be: (1) were at least 18 years of age, (2) were the FCG of a PWD at home, and (3) consented to participate in the study. PWD and FCGs were excluded if they had an active mental disorder (e.g., depression or anxiety disorder) or had previous experience with music therapy.
Measures
Demographic and clinical characteristics
Demographic characteristics for PWD encompassed age, gender, degree of activities of daily living (ADL), months since dementia diagnosis, and severity of cognitive impairment. Assessments were conducted using the Katz Index of Independence in ADL (Katz ADL).22 The Katz ADL comprises six items with binary response options (0 for dependent, 1 for independent), evaluating tasks such as bathing, dressing, feeding, transferring, toileting, and continence. A higher Katz ADL score indicates a higher level of independence. Demographic characteristics for FCGs encompassed age, gender and their subjective assessment of general health. Utilizing a singular query, FCGs were asked to rate their overall physical health, choosing from five options ranging from “excellent” to “poor.”
Salivary cortisol and DHEA-S
Among both PWD and FCGs, each participant was asked to collect 120 saliva samples. The samples were collected three times a day (twice in the morning [immediately after awakening and 15 minutes after the first sample’s collection] and once in the evening [before bedtime]). This sampling process was performed five days per week (from Sunday evening to Friday morning) for eight consecutive weeks. Participants were allowed to collect the samples based on their own diurnal cycle rather than at specific times. In this study, the first morning sample and the evening sample were used for the analysis; in the three specimen collections where the first morning sample was inadequate in quantity or unusable for other reasons, the second morning sample was employed.
Saliva was collected using the SalivaBio Children’s Swab for PWD and the passive drool method for FCGs.23,24 Before saliva collection began, the study coordinator provided each participant with saliva tubes and a storage box and explained in detail the process of saliva collection and storage. Participants were asked to place the tubes with samples in a designated bag and store them in their home refrigerator immediately after sample collection. Each morning, saliva samples were collected from participants’ homes by trained aides and promptly stored in a refrigerated container designed for biological specimens. Subsequently, the samples were transported to the Biobank at the Karolinska Institutet and securely stored until they were dispatched to a laboratory for analysis. Throughout the eight-week study duration, the study coordinator conducted weekly reminder calls to participants and addressed any concerns related to sample collection. The comprehensive protocol for saliva collection was outlined in the parent study.11
In the intervention group, PWD and FCGs participated in an online, in-home music intervention, throughout the eight weeks of the study period. The detailed design is described in the parent study.11
Statistical analysis
Demographic variables were summarized by PWD/FCG. Continuous variables were described with number of observations, mean, standard deviation, and minimum and maximum values. Dichotomous and categorical variables were described with numbers and percentages.
Primary endpoints were residuals obtained from linear regressions of morning and evening salivary cortisol and morning DHEA-S on time in days for each participant, with addition of the participant’s overall mean value. The rationale to use residuals was that any linear trends (possibly due to intervention) should be removed. The variations for intervention and control groups are not analyzed separately but rather as mean variations over groups. Thus, our results will be that groups should be followed for the same number of sampling days regardless of possible diverging variability patterns. Due to skewed distributions, all analyses were based on variable values transformed with natural logarithms.
Number of required sampling days to detect effect differences
Consecutive measurements of salivary biomarkers are likely to be correlated, i.e, autocorrelated. The autocorrelation is a measure of dependence between the current observation and one immediately prior. Without autocorrelation, measurements vary randomly around a mean level (or a linear trend) but with autocorrelation data show longer swings. Hence, higher autocorrelation induces lower precision in estimates of mean values as two consecutive measurements provide only marginally more information than a single measurement.
We used a mixed linear model with participant as the random factor and uncorrelated or first-order autocorrelated errors and compared these models with a likelihood ratio test for all primary endpoints. The model with first order autocorrelated errors had a significantly better fit (P < 0.05) than the model with uncorrelated errors for all primary endpoints for both PWD and FCG.
We estimated pooled intra-individual standard deviations (SDWs) and autoregression parameters r, with asymptotic standard errors from a mixed linear model with first order autocorrelated errors for each primary endpoint as dependent variable and participant as random factor, by PWD/FCG groups. Coefficients of variation (CV), i.e., pooled SDWs as a percentage of the total mean, and ICCs, i.e. variances between participants divided by total variances, were calculated and presented with 95% confidence intervals.25
To find the number of sampling days required to reduce bias in estimated associations when salivary morning and evening cortisol and morning DHEA-S are exposure variables in risk factor models for future disease, ICCs were calculated based on mean values from two to ten days of saliva collection and were presented with 95% confidence intervals based on the bootstrap percentile method. The criterion for required number of sampling days was that relative regression dilution bias should be less than 10% for all primary endpoints for both PWDs and FCGs.
Combined pooled SDWs and r by PWD/FCG were utilized to estimate the number of required sampling days to detect effect differences between two groups in a randomized clinical trial. The clinical trial setting is assumed to be baseline measurements collected during a number of consecutive days (nd) before randomization and at an equal number of consecutive days at the endpoint when an intervention effect is assumed to be established. Endpoint group means of the individual mean values are assumed to be compared with adjustment for mean baseline measurements.
Let n be the number of participating dyads. Delta is a difference between group effects. Alpha is type I error and beta is the power of the test. t1-alpha/2,2*n-2 is a quantile from a t distribution with 2*n-2 degrees of freedom, zbeta is a quantile of the standardized normal distribution. For power 80% zbeta is 0.842. Then, nd = SDW2*4*(t1-alpha/2,2*n-2 + zbeta)2/n*delta2 for uncorrelated measurements. The variance of a mean of nd uncorrelated measurements is SDW2/nd. For autocorrelated measurements the corresponding variance is SDW2*(1/nd-2*r*(1-rnd)/(nd2*(1-r2)))/((1-r)2.26
With autocorrelation nd should be inflated with the ratio between these variances. Thus, nd = (nd*r2-nd + 2*r-2*r(1 + nd))/(nd*(r-1)3*(r + 1))*(SDW2/(1-r2))*4*(t1-alpha/2,2*n-2 + zbeta)2/n*delta2 which can be solved with numerical methods. For this purpose, we used PROC NLIN in SASTM.
This calculation assumes normally distributed data (possibly after logarithmic transformation). For log cortisol and log DHEA-S means of nd measurements will likely be normally distributed if nd is sufficiently large, say at least 5, due to the central limit theorem.27 If the normality assumption cannot be justified, the number of dyads (n) should be increased by 10% to account for a non-parametric test.
nd was calculated for selected values of n and delta which is the difference in treatment effects expressed as percentages (from 5 to 10) of baseline mean levels for all primary endpoints for type I error 5% and power 80%. In a study by Crawford et al. odds ratio for coronary heart disease (CHD) per standard deviation increase in morning plasma cortisol was 1.1828 which implies that in logarithmic scale decreases in morning cortisol of 5% and 10% of baseline mean level indicate approximately 10% and 15% lower risk for CHD, respectively, thus motivating the choice of effect sizes 5% to 10% of baseline mean levels.
We assume that in dyad studies it is most practical to collect saliva samples during the same number of days for the PWD and his/her caregiver. Therefore, our calculations were made based on PWD and on FCG and the maximum of those nd values was presented.
Results
Baseline characteristics of PWD and FCGs are summarized in Table 1.
Table 1.
Baseline sample characteristics for persons with dementia and the family caregivers
|
|
Persons with dementia
(n=34)
|
Family caregivers
(n=34)
|
| Age (years), mean (SD) (range) |
78.6 (7.6) (60-92) |
74.5 (10.3) (37-90) |
| Gender, No. (%) |
|
|
| Female |
11 (32) |
22 (65) |
| Male |
23 (68) |
12 (35) |
| Activities of Daily Livinga, mean (SD) (range) |
2.5 ± 1.7 (0–6) |
- |
| Months from dementia diagnosis to study inclusionb, mean (SD) (range) |
20.8 ± 14.5 (5–61) |
- |
| Global Deterioration Scalea mean (SD) (range) |
4.8 ± 1.0 (4–7) |
- |
| GDSb, No. (%) |
|
|
| Moderate cognitive decline |
17 (50) |
- |
| Moderately severe cognitive decline |
8 (24) |
- |
| Severe cognitive decline |
7 (21) |
- |
| Very severe cognitive decline |
2 (6) |
- |
| Perceived general healthc, No. (%) |
|
|
| Excellent |
- |
1 (3) |
| Very good |
- |
11 (33) |
| Good |
- |
13 (39) |
| Fair |
- |
8 (24) |
| Poor |
- |
0 (0) |
Note: SD = standard deviation
ADL scores of PWD were reported by their FCG.
GDS scores of PWD were reported by the study coordinator.
aOne PWD was excluded due to the incompleteness of the item.
bTwo PWDs were excluded due to the incompleteness of the item.
cOne FCG participant was excluded due to the incompleteness of the item.
In Table 2, SDW measures, CVs with 95% confidence intervals and ICCs with 95% confidence intervals are presented for PWD and FCG. ICCs were between 0.70-0.84 for log morning and log evening cortisol while for log morning DHEA-S ICCs were 0.59-0.65. We calculated ICCs based on the mean of two to ten consecutive collection days, and with six consecutive collection days the criterion of all ICCs being at least 0.90 was fulfilled, and these ICCs (ICC6s) are presented in Table 2 with 95% confidence intervals.
Table 2.
Variability measures for persons with dementia (n = 34) and the family caregivers (n = 34)
|
Primary endpoint*
|
Stratum
|
k
|
Mean
|
SDB
|
SDW
|
CV% (95% CI)
|
ICC (95% CI)
|
ICC6 (95% CI)
|
Log morning cortisol
(pg/mL) |
Persons with dementia |
981 |
7.68 |
1.28 |
0.56 |
7.2 (6.8, 7.7) |
0.84 (0.77, 0.90) |
0.97 (0.94, 0.98) |
| Caregivers |
1007 |
7.70 |
1.11 |
0.69 |
9.0 (8.4, 9.6) |
0.73 (0.61, 0.81) |
0.92 (0.86, 0.96) |
| Log DHEA-S (pg/mL) |
Persons with dementia |
896 |
8.15 |
0.95 |
0.70 |
8.6 (8.2, 9.0) |
0.65 (0.53, 0.75) |
0.91 (0.84, 0.95) |
| Caregivers |
923 |
7.63 |
1.38 |
1.15 |
15.2 (14.2, 16.3) |
0.59 (0.45, 0.71) |
0.93 (0.83, 0.98) |
Log evening cortisol
(pg/mL) |
Persons with dementia |
989 |
6.59 |
1.60 |
0.85 |
12.9 (11.8, 14.1) |
0.78 (0.68, 0.85) |
0.93 (0.88, 0.96) |
| Caregivers |
995 |
6.18 |
1.33 |
0.87 |
14.2 (13.0, 15.4) |
0.70 (0.59, 0.79) |
0.91 (0.84, 0.96) |
k = total number of observations; SDB = between-individuals standard deviation; SDW = intra-individual standard deviation; CV = coefficient of variation; ICC = intra-class correlation coefficient; ICC6 = intra-class correlation coefficient based on mean of six consecutive collection days.
*Values are residuals from linear regressions of log of variables on time in days for each participant with addition of the participant’s overall mean value.
Mean is overall mean based on all observations.
For log morning cortisol, ICC = 0.84 for PWD which implies that the expected bias of the slope in a simple regression model is 16%, underestimation of the true slope when a single measurement of morning cortisol is used. For a mean value from six consecutive collection days the corresponding ICC = 0.97, i.e., the expected bias is 3%. For all primary endpoints for both PWDs and FCGs the expected bias of the slope in a simple linear regression model would be less than 10% with six consecutive collection days (Table 2).
Figure 1 displays the number of sampling days required to detect a given treatment effect in primary endpoints, i.e., difference between an intervention and a control group as a percentage of mean levels, for a given number of participating dyads when the significance level is 5% and power is 80%. For example, for log morning cortisol (Figure 1a) and treatment effect 7%, three sampling days during baseline and during end of study are required when 20 dyads participate in the study. Baseline mean log cortisol (pg/mL) in our study is 7.69 and thus the treatment effect 7% corresponds to a 0.54 larger decrease of log morning cortisol in the intervention group than in the control group. Figure 1b shows the corresponding requirements for evening cortisol. It is important that the differences displayed are expressed as percentages of baseline mean values. Absolute morning cortisol levels are much higher than absolute evening cortisol levels in this study as in all similar studies, but it is observed that slightly lower numbers of sampling days are required for proven percentage differences for evening than for morning cortisol – which is due to a smaller variance in evening than in morning cortisol levels. Figure 1c finally shows the corresponding situation for DHEA-S. As the figure clearly shows, proving percentage differences requires larger numbers of sampling days. This is due to the fact that DHEA-S has a more pronounced variability from day to day than both morning and evening cortisol.
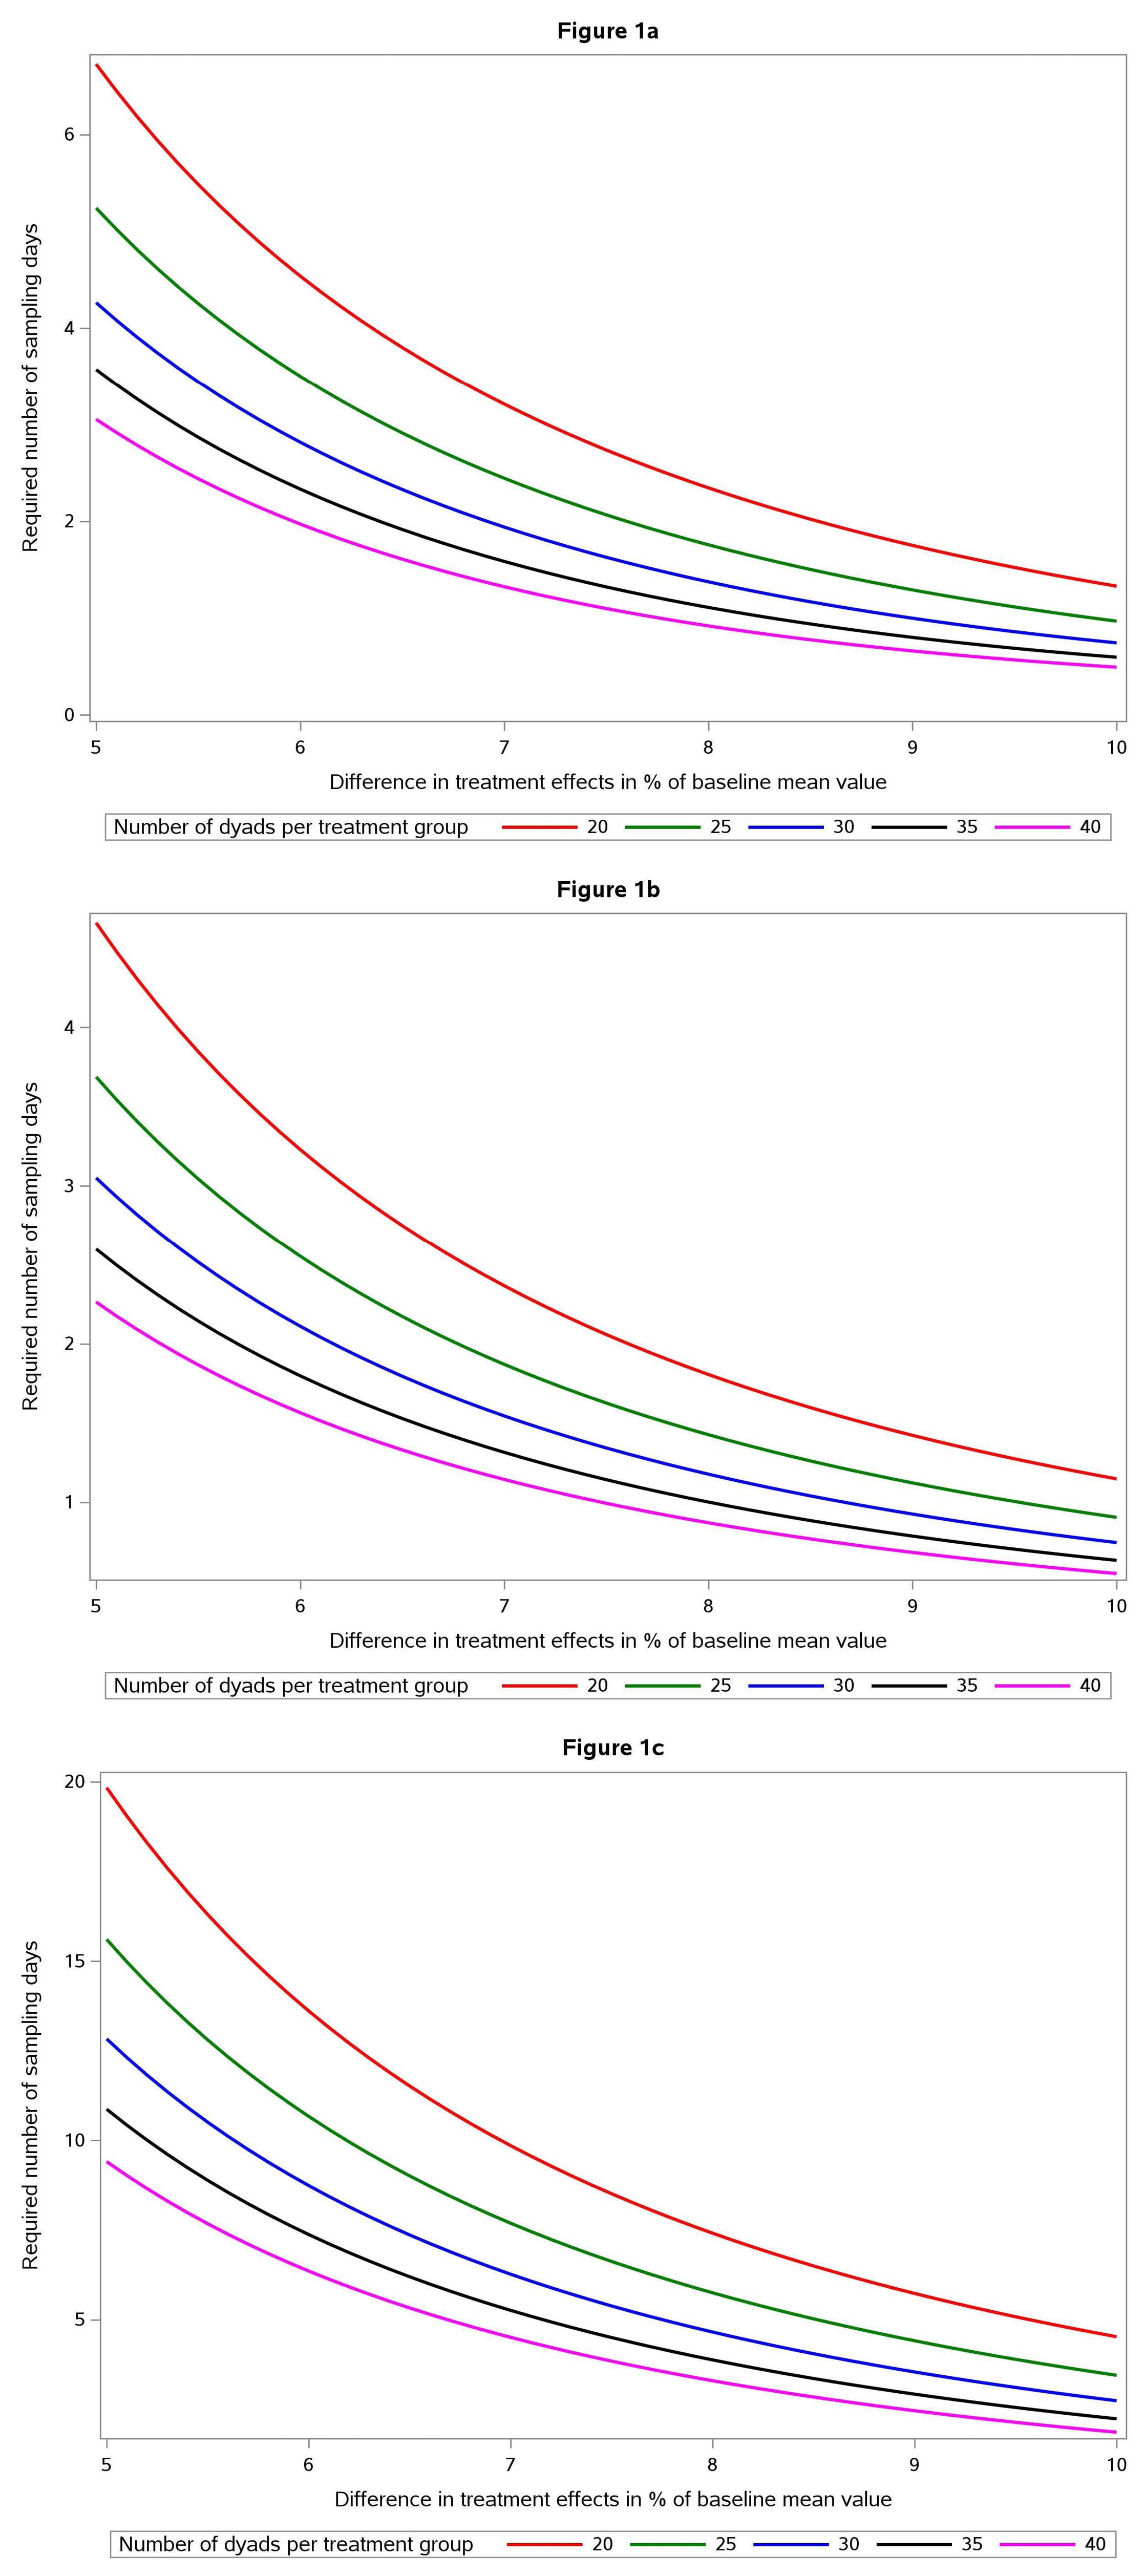
Figure 1.
(a) Nomogram describing number of sampling days (y axis) required for sufficient statistical power to prove a morning cortisol difference between an intervention group and a control group with P < 00.05 and power 0.80. The diagram shows five different alternatives, with number of dyads ranging from 20 (red) to 40 (violet) and difference in “treatment effect” expressed as difference in percent of baseline (x axis) ranging from 5 to 10 percent. (b) Nomogram describing number of sampling days (y axis) required for sufficient statistical power to prove an evening cortisol difference between an intervention group and a control group with P < 0.05 and power 0.80. The diagram shows five different alternatives, with number of dyads ranging from 20 (red) to 40 (violet) and difference in “treatment effect” expressed as difference in percent of baseline (x axis) ranging from 5 to 10 percent. (c) Nomogram describing number of sampling days (y axis) required for sufficient statistical power to prove a DHEAS difference between an intervention group and a control group with P < 0.05 and power 0.80. The diagram shows five different alternatives, with number of dyads ranging from 20 (red) to 40 (violet) and difference in “treatment effect” expressed as difference in percent of baseline (x axis) ranging from 5 to 10 percent
.
(a) Nomogram describing number of sampling days (y axis) required for sufficient statistical power to prove a morning cortisol difference between an intervention group and a control group with P < 00.05 and power 0.80. The diagram shows five different alternatives, with number of dyads ranging from 20 (red) to 40 (violet) and difference in “treatment effect” expressed as difference in percent of baseline (x axis) ranging from 5 to 10 percent. (b) Nomogram describing number of sampling days (y axis) required for sufficient statistical power to prove an evening cortisol difference between an intervention group and a control group with P < 0.05 and power 0.80. The diagram shows five different alternatives, with number of dyads ranging from 20 (red) to 40 (violet) and difference in “treatment effect” expressed as difference in percent of baseline (x axis) ranging from 5 to 10 percent. (c) Nomogram describing number of sampling days (y axis) required for sufficient statistical power to prove a DHEAS difference between an intervention group and a control group with P < 0.05 and power 0.80. The diagram shows five different alternatives, with number of dyads ranging from 20 (red) to 40 (violet) and difference in “treatment effect” expressed as difference in percent of baseline (x axis) ranging from 5 to 10 percent
Discussion
For planning of future dyad studies among PWD and their FCG we present a formula and graphical tools to facilitate calculation of number of required sampling days to detect treatment differences between intervention and control groups. We propose that measurement of treatment effect at study termination and baseline measurements is based on the same number of sampling days. If it is not feasible to measure, for example, 10 days at baseline as in Figure 1c (treatment effect 6% and 20 participating dyads), the number of dyads could be increased to 30 so that the number of sampling days is reduced to six.
To reduce regression dilution bias to less than 10% we recommend that collection be based on at least six consecutive days when saliva steroids are to be used as exposure variables in regression models with future disease as outcome.
Our estimates of ICC were higher than in a meta-analysis,29 which presented a reliability ratio (a measure similar to ICC) of 0.55 for morning cortisol whereas our ICCs were 0.73-0.84. The meta-analysis reliability ratio estimate was based on comparison of morning cortisol from two adjacent days for community dwelling elderly men, whereas we investigated PWD and their FCGs of both sexes, and our estimate of ICCs were based on a much larger number of collection days.
A possible limitation of the study is that we used data from a trial with a music intervention. However, it is unlikely that stress biomarker variability among dyads of PWDs and FCGs differ substantially due the actual intervention. A strength of our study is that we used data from daily measurements during eight weeks and thus the analyses were based on a large number of observations.
Conclusion
Reliability of dyad studies in which stress hormones are measured depends on understanding and incorporating into the study design knowledge of the relationship between number of dyads studied and duration of the sampling in days. Our findings provide methods for making calculations with which investigators can reliably estimate, during the study design phase, whether they have met the required thresholds for data reliability so that the study can produce credible results. In general, our experiment reveals a significant day-to-day variability in the studied hormones. This variability must be considered when planning empirical studies. Our large sample size allowed us to determine the necessary number of samples for adequate statistical power, given the number of subjects, for morning cortisol, evening cortisol, and DHEA-S.
Acknowledgments
The authors would like to thank the study participants. The authors also gratefully acknowledge support from the Yale School of Nursing and the Department of Neurobiology, Care Sciences, & Society Division of Occupational Therapy, Karolinska Institutet and Brian Weiss for professional manuscript editing.
Competing Interests
The authors declare no conflicts of interest.
Ethical Approval
Study procedures were conducted in accordance with the Declaration of Helsinki under the approval of the Karolinska Institute Institutional Review Board (Dnr: 2018/1596-31/2). All participants completed the informed consent process prior to initiation of any study procedures.
References
- Sallim AB, Sayampanathan AA, Cuttilan A, Ho R. Prevalence of mental health disorders among caregivers of patients with Alzheimer disease. J Am Med Dir Assoc 2015; 16(12):1034-41. doi: 10.1016/j.jamda.2015.09.007 [Crossref] [ Google Scholar]
- Alberini CM. Unwind: chronic stress exacerbates the deficits of Alzheimer’s disease. Biol Psychiatry 2009; 65(11):916-7. doi: 10.1016/j.biopsych.2009.04.001 [Crossref] [ Google Scholar]
- Justice NJ. The relationship between stress and Alzheimer’s disease. Neurobiol Stress 2018; 8:127-33. doi: 10.1016/j.ynstr.2018.04.002 [Crossref] [ Google Scholar]
- Smith M, Gerdner LA, Hall GR, Buckwalter KC. History, development, and future of the progressively lowered stress threshold: a conceptual model for dementia care. J Am Geriatr Soc 2004; 52(10):1755-60. doi: 10.1111/j.1532-5415.2004.52473.x [Crossref] [ Google Scholar]
- World Health Organization (WHO). Global Dementia Observatory (GDO) [Internet]. WHO;2021. Available from: https://www.who.int/data/gho/data/themes/global-dementia-observatory-gdo. Accessed June 5, 2024.
- Schneiderman N, Ironson G, Siegel SD. Stress and health: psychological, behavioral, and biological determinants. Annu Rev Clin Psychol 2005; 1:607-28. doi: 10.1146/annurev.clinpsy.1.102803.144141 [Crossref] [ Google Scholar]
- Debono M, Ghobadi C, Rostami-Hodjegan A, Huatan H, Campbell MJ, Newell-Price J. Modified-release hydrocortisone to provide circadian cortisol profiles. J Clin Endocrinol Metab 2009; 94(5):1548-54. doi: 10.1210/jc.2008-2380 [Crossref] [ Google Scholar]
- Morgan CA 3rd, Southwick S, Hazlett G, Rasmusson A, Hoyt G, Zimolo Z. Relationships among plasma dehydroepiandrosterone sulfate and cortisol levels, symptoms of dissociation, and objective performance in humans exposed to acute stress. Arch Gen Psychiatry 2004; 61(8):819-25. doi: 10.1001/archpsyc.61.8.819 [Crossref] [ Google Scholar]
- Blair J, Adaway J, Keevil B, Ross R. Salivary cortisol and cortisone in the clinical setting. Curr Opin Endocrinol Diabetes Obes 2017; 24(3):161-8. doi: 10.1097/med.0000000000000328 [Crossref] [ Google Scholar]
- Hellhammer DH, Wüst S, Kudielka BM. Salivary cortisol as a biomarker in stress research. Psychoneuroendocrinology 2009; 34(2):163-71. doi: 10.1016/j.psyneuen.2008.10.026 [Crossref] [ Google Scholar]
- Emami A, Hallinder H, Theorell T, Kim H, Engström G. The feasibility and acceptability of in-home saliva collection for stress in persons with dementia and their family caregivers. Biol Res Nurs 2022; 24(3):308-15. doi: 10.1177/10998004221076554 [Crossref] [ Google Scholar]
- Wuttke-Linnemann A, Baake R, Fellgiebel A. Dyadic wind of change: new approaches to improve biopsychological stress regulation in patients with dementia and their spousal caregivers. J Alzheimers Dis 2019; 68(4):1325-37. doi: 10.3233/jad-181025 [Crossref] [ Google Scholar]
- Gilhooly KJ, Gilhooly ML, Sullivan MP, McIntyre A, Wilson L, Harding E. A meta-review of stress, coping and interventions in dementia and dementia caregiving. BMC Geriatr 2016; 16:106. doi: 10.1186/s12877-016-0280-8 [Crossref] [ Google Scholar]
- Ouanes S, Popp J. High cortisol and the risk of dementia and Alzheimer’s disease: a review of the literature. Front Aging Neurosci 2019; 11:43. doi: 10.3389/fnagi.2019.00043 [Crossref] [ Google Scholar]
- Liang A, Piroth I, Robinson H, MacDonald B, Fisher M, Nater UM. A pilot randomized trial of a companion robot for people with dementia living in the community. J Am Med Dir Assoc 2017; 18(10):871-8. doi: 10.1016/j.jamda.2017.05.019 [Crossref] [ Google Scholar]
- Wong MM, Tahir T, Wong MM, Baron A, Finnerty R. Biomarkers of stress in music interventions: a systematic review. J Music Ther 2021; 58(3):241-77. doi: 10.1093/jmt/thab003 [Crossref] [ Google Scholar]
- Theorell T, Engström G, Hallinder H, Lennartsson AK, Kowalski J, Emami A. The use of saliva steroids (cortisol and DHEA-s) as biomarkers of changing stress levels in people with dementia and their caregivers: a pilot study. Sci Prog 2021; 104(2):368504211019856. doi: 10.1177/00368504211019856 [Crossref] [ Google Scholar]
- Berglund L. Regression dilution bias: tools for correction methods and sample size calculation. Ups J Med Sci 2012; 117(3):279-83. doi: 10.3109/03009734.2012.668143 [Crossref] [ Google Scholar]
- Keogh RH, Shaw PA, Gustafson P, Carroll RJ, Deffner V, Dodd KW. STRATOS guidance document on measurement error and misclassification of variables in observational epidemiology: part 1-basic theory and simple methods of adjustment. Stat Med 2020; 39(16):2197-231. doi: 10.1002/sim.8532 [Crossref] [ Google Scholar]
- Reisberg B, Ferris SH, de Leon MJ, Crook T. The Global Deterioration Scale for assessment of primary degenerative dementia. Am J Psychiatry 1982; 139(9):1136-9. doi: 10.1176/ajp.139.9.1136 [Crossref] [ Google Scholar]
- Finkel SI, Lyons JS, Anderson RL. A brief agitation rating scale (BARS) for nursing home elderly. J Am Geriatr Soc 1993; 41(1):50-2. doi: 10.1111/j.1532-5415.1993.tb05948.x [Crossref] [ Google Scholar]
- Katz S, Ford AB, Moskowitz RW, Jackson BA, Jaffe MW. Studies of illness in the aged the index of ADL: a standardized measure of biological and psychosocial function. JAMA 1963; 185:914-9. doi: 10.1001/jama.1963.03060120024016 [Crossref] [ Google Scholar]
- Salimetrics. Collection Method: SalivaBio Children’s Swab (SCS) Instructions for Use. State College, PA: Salimetrics; 2024. Available from: https://salimetrics.com/wp-content/uploads/2018/02/children-swab-saliva-collection-instructions.pdf. Updated March 1, 2024. Accessed June 6, 2024.
- Salimetrics. Collection Methods: Passive Drool using the Saliva Collection Aid. State College, PA: Salimetrics; 2023 Available from: https://salimetrics.com/wp-content/uploads/2018/02/passive-drool-saliva-collection-instructions.pdf. Updated July 28, 2023. Accessed June 6, 2024.
- Hankinson SE, Manson JE, Spiegelman D, Willett WC, Longcope C, Speizer FE. Reproducibility of plasma hormone levels in postmenopausal women over a 2-3-year period. Cancer Epidemiol Biomarkers Prev 1995; 4(6):649-54. [ Google Scholar]
- Vrbik J. Population moments of sampling distributions. Comput Stat 2005; 20(4):611-21. doi: 10.1007/bf02741318 [Crossref] [ Google Scholar]
- Kendall M, Stuart A. The Advanced Theory of Statistics. 4th ed. New York: Macmillan Publishers; 1977. p. 206-8.
- Crawford AA, Soderberg S, Kirschbaum C, Murphy L, Eliasson M, Ebrahim S. Morning plasma cortisol as a cardiovascular risk factor: findings from prospective cohort and Mendelian randomization studies. Eur J Endocrinol 2019; 181(4):429-38. doi: 10.1530/eje-19-0161 [Crossref] [ Google Scholar]
- Stafford M, Ben-Shlomo Y, Cooper C, Gale C, Gardner MP, Geoffroy MC. Diurnal cortisol and mental well-being in middle and older age: evidence from four cohort studies. BMJ Open 2017; 7(10):e016085. doi: 10.1136/bmjopen-2017-016085 [Crossref] [ Google Scholar]